Part 2: Visualising the lattice structure
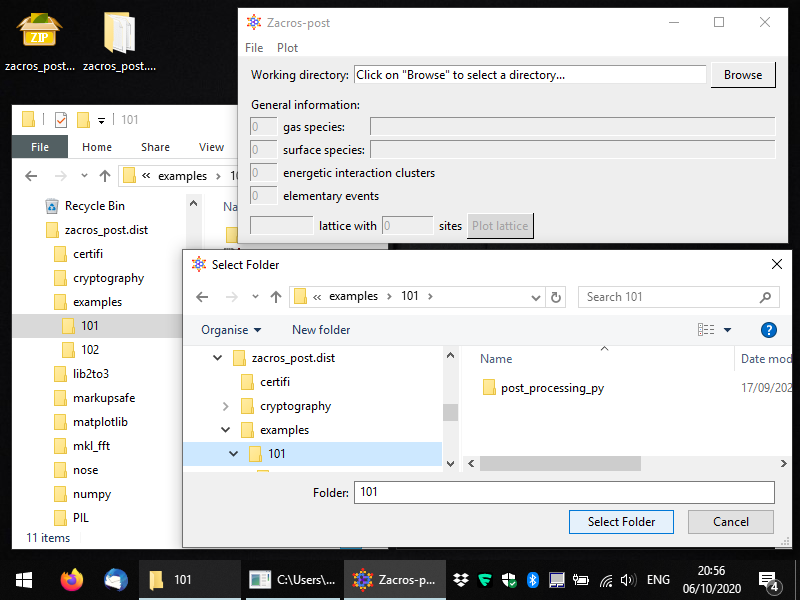
After completing the previously described steps, you should have a working installation of Zacros-post! Once you run the program again, you will see something like the snaphost below. At this point, you can click on "Browse" and navigate to the directory that contains the Zacros output that you want to post-process and visualise. Equivalently, you can just use the menu command: File > Open directory. Note that (at least in Windows) the browsing-window does not list any files, only directories (folders). Zacros-post comes with two Zacros output samples, which you can find in the directory "examples", as shown below: subdirectories 101 and 102 (these are the same as in the Zacros distribution, but in Zacros-post they also contain a post-processing subdirectory each).

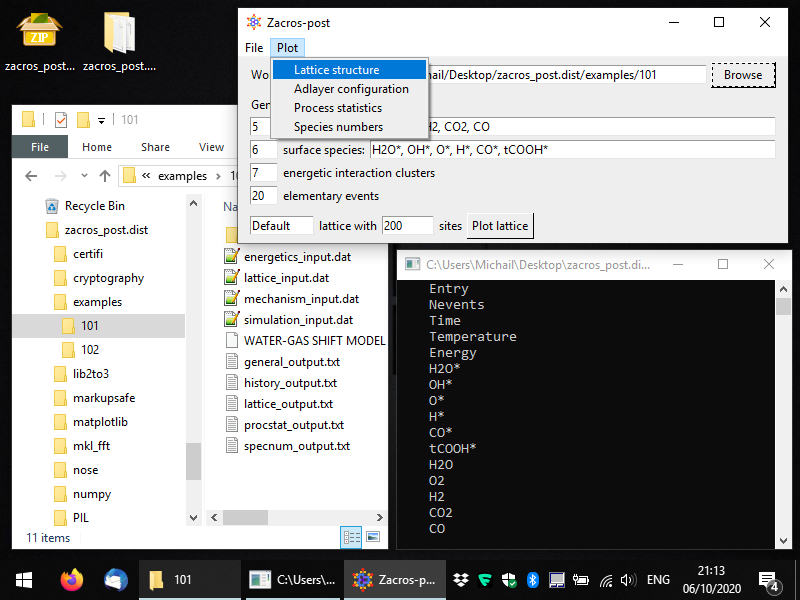
Here, we will work with example 101. Once you select the folder you want to process, you should see some key general information coming up in the Zacros-post interface. This is just intended as a reminder of what the simulation was about... Next, you can click on the "Plot lattice" button, or equivalently from the menu you can select: Plot > Lattice structure, as shown below.

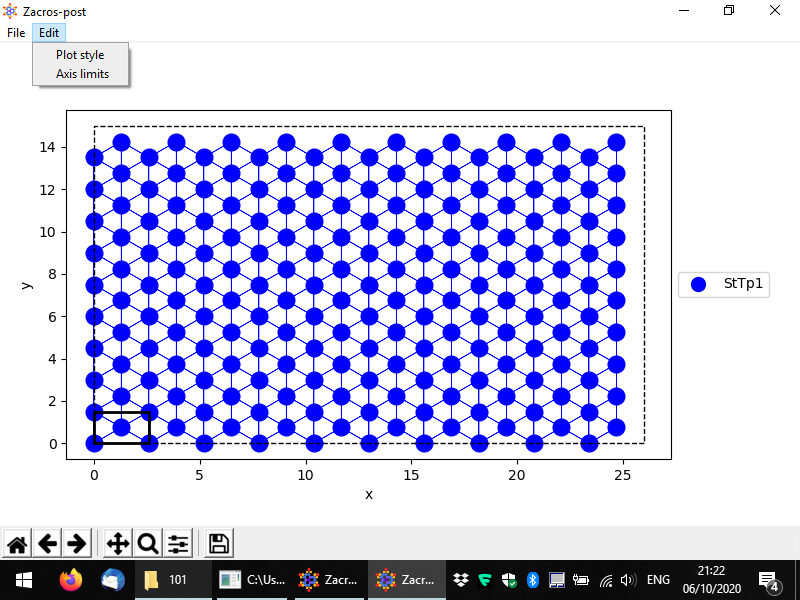
This will start the lattice structure plotting app, which is shown below in full screen. The lattice sites and their connectivity are displayed by default, and the unit cell is highlighted. Sites of different types are shown in different colours and markers, though, in this example, there is only one site type, so all sites are displayed as blue filled circles.
The menu provides options for saving the plot in pdf and png formats and also for customising the style of the plot and the axes limits (as shown). In the bottom, the standard controls of Matplotlib are provided so that you can for instance pan and zoom into the plot, set the white margins and save the plot in many different formats.

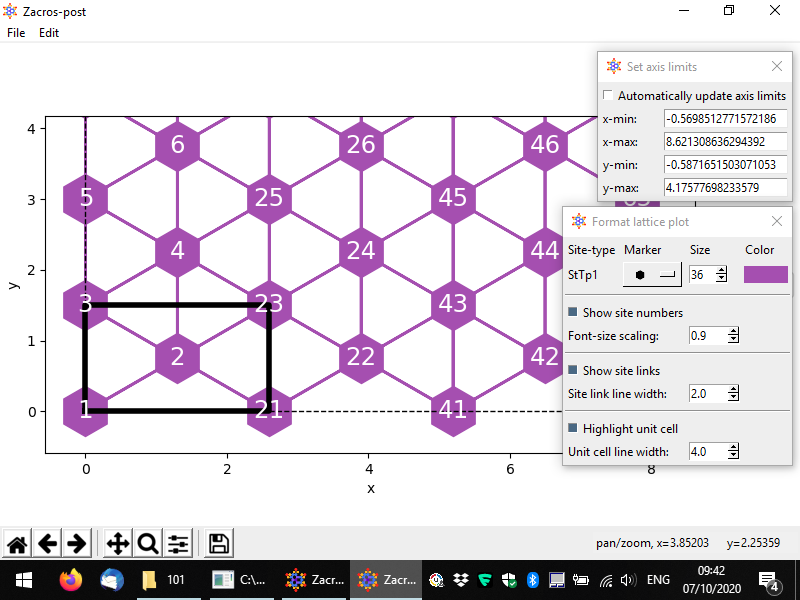
There are quite a few options for changing the style of the plot. In the following we demonstrate an example of a customised lattice. The styling options and the controls are quite intuitive: there is a dropdown menu providing different options for the markers of each site type (here only one type, "StTp1"), and spinboxes for the sizes of graphical elements in the plot. Also, by clicking on the coloured rectangle, you can select a colour for the sites. The colours of the links are automatically determined (by averaging out the colours of the two connected sites). Finally, you can change the limits of each axis, or if you'd like to go back to the original axes limits, you can check the box "Automatically update axis limits".

Once you are done you can close the lattice post-processing app from the menu (File > Close) or simply by closing the lattice window. You may notice the following message on the terminal: "Saved settings of lattice structure plotting app to postprocessing.xml". Indeed, Zacros-post saves all the settings you have customised to that file so that, when you open the same directory again, you won't have to re-apply all the customisations you made. Thus, next time you open directory "examples\101" and try to plot the lattice, you should see exactly what you saw just before closing the lattice post-processing view last time.
Next we will look into the postprocessing of the history output file, and the visualisation of adsorbate layer (adlayer) configurations.


