Part 3: Visualising and extracting adlayer configurations
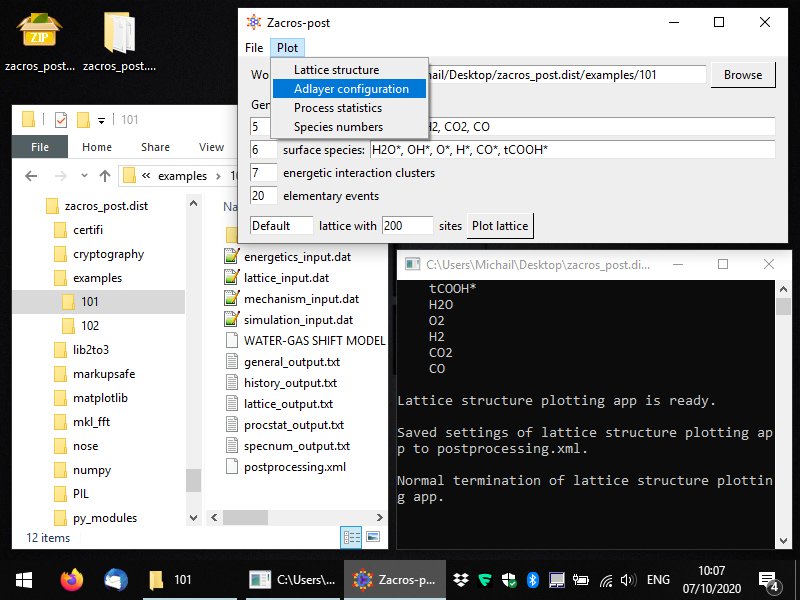
During the course of the KMC simulation, Zacros outputs the occupancy of each site of the lattice in the history_output.dat file. Zacros-post can extract and visualise configurations from this file, and it can also save them in a format that Zacros can use to start a new simulation from (state_input.dat file). To start the post-procssing of adlayer configurations, you can select Plot > Adlayer configuration from the main window of Zacros-post as shown below (in this snapshot, notice also the postprocessing.xml file in Windows Explorer).

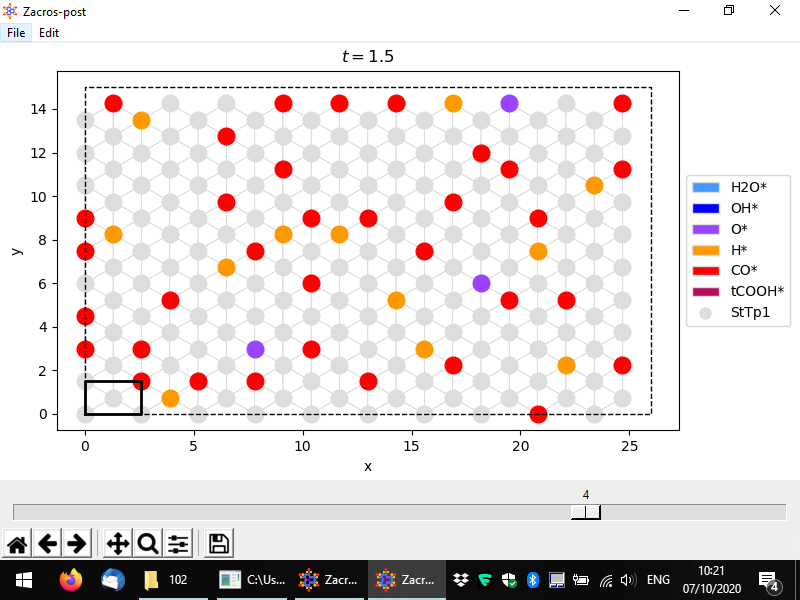
Once you've selected this menu option, you should see a window coming up, as shown in full screen in the following snapshot. In this simulation, we have saved 5 lattice configurations, and the slider in the bottom allows us to select any of them. By default, the last one is plotted; here we have changed this, to plot the 4th configuration, which corresponds to time 1.5, as shown in the title of the plot. Vacant sites are displayed with grey colors using different markers for each site type. Their connectivity is also plotted, and the unit cell is highlighted by default. Sites occupied by adsorbate species are coloured depending on the species. The legend on the right of the plot, shows the colors and markers corresponding to species and site types, respectively. Here we have 6 different species and 1 site type (the latter denoted by circles, as is the default option).

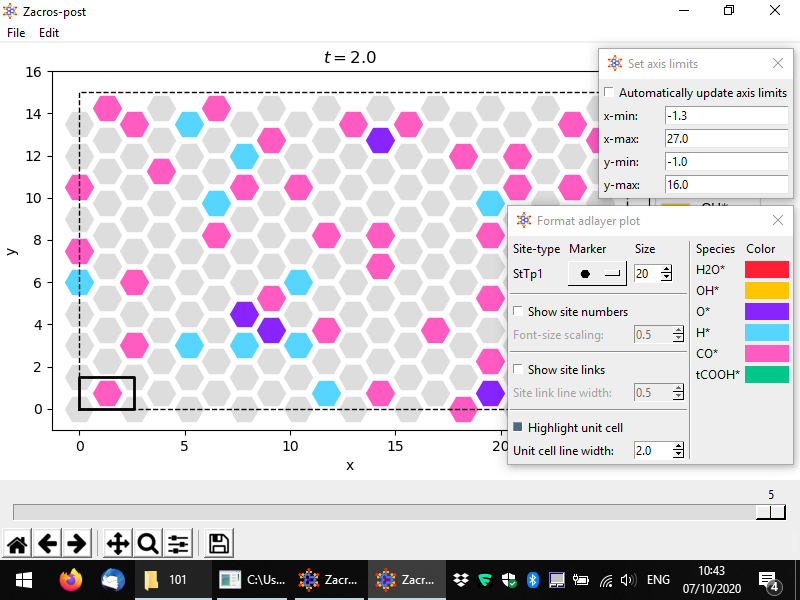
The usual options for panning, zooming, adjusting the white margins or saving the plot can be found in the bottom toolbar. Additionally, the options of saving the plot into png or pdf formats can be found in the File menu option, in addition to the "Save state input" option. The latter can be used to extract the current configuration into a file named "state_input_ExtrConf#.dat", where # is the number of the configuration processed. This file has to be renamed to state_input.dat, if it is to be used as input to a new Zacros simulation. The visual appearance and the axes limits of the plot can be adjusted using the options under Edit. The pertinent controls are shown below.

When you are finished you can close the adlayer configuration post-processing app from the menu (File > Close) or by closing the lattice window, as with the lattice processing app. As with all the post-processing and plotting apps, the customisations you applied to the adlayer configuration will be saved into postprocessing.xml.
In the next part we will showcase and discuss the postprocessing of the event statistics.


